


KEY ADVANTAGES
-

11-HD 3D Images
-

3D Modeling
-

Aging
-

Sensitive skin
-

Hyperpigmentation
-

Moisture balance
-

Support multi-port access
-

Data center


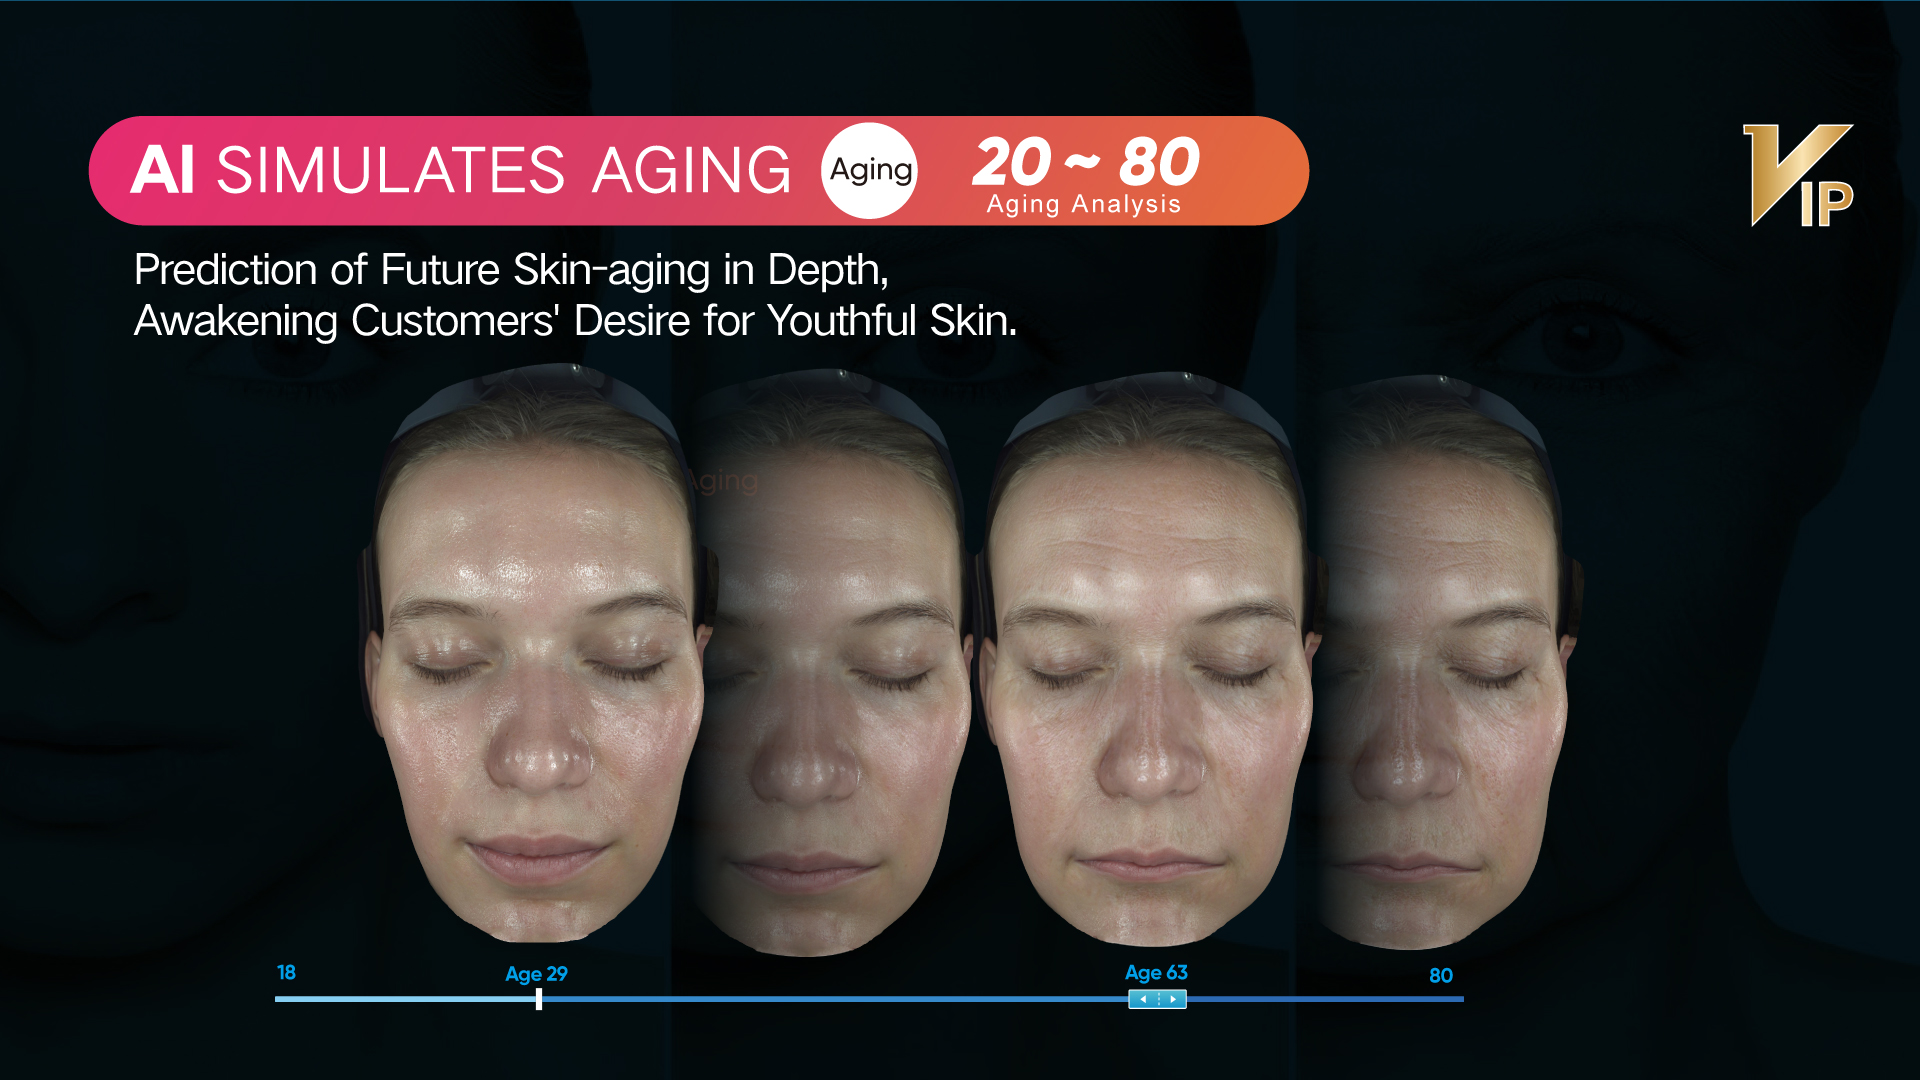
Visualization of skin aging
—————————————————————————————————
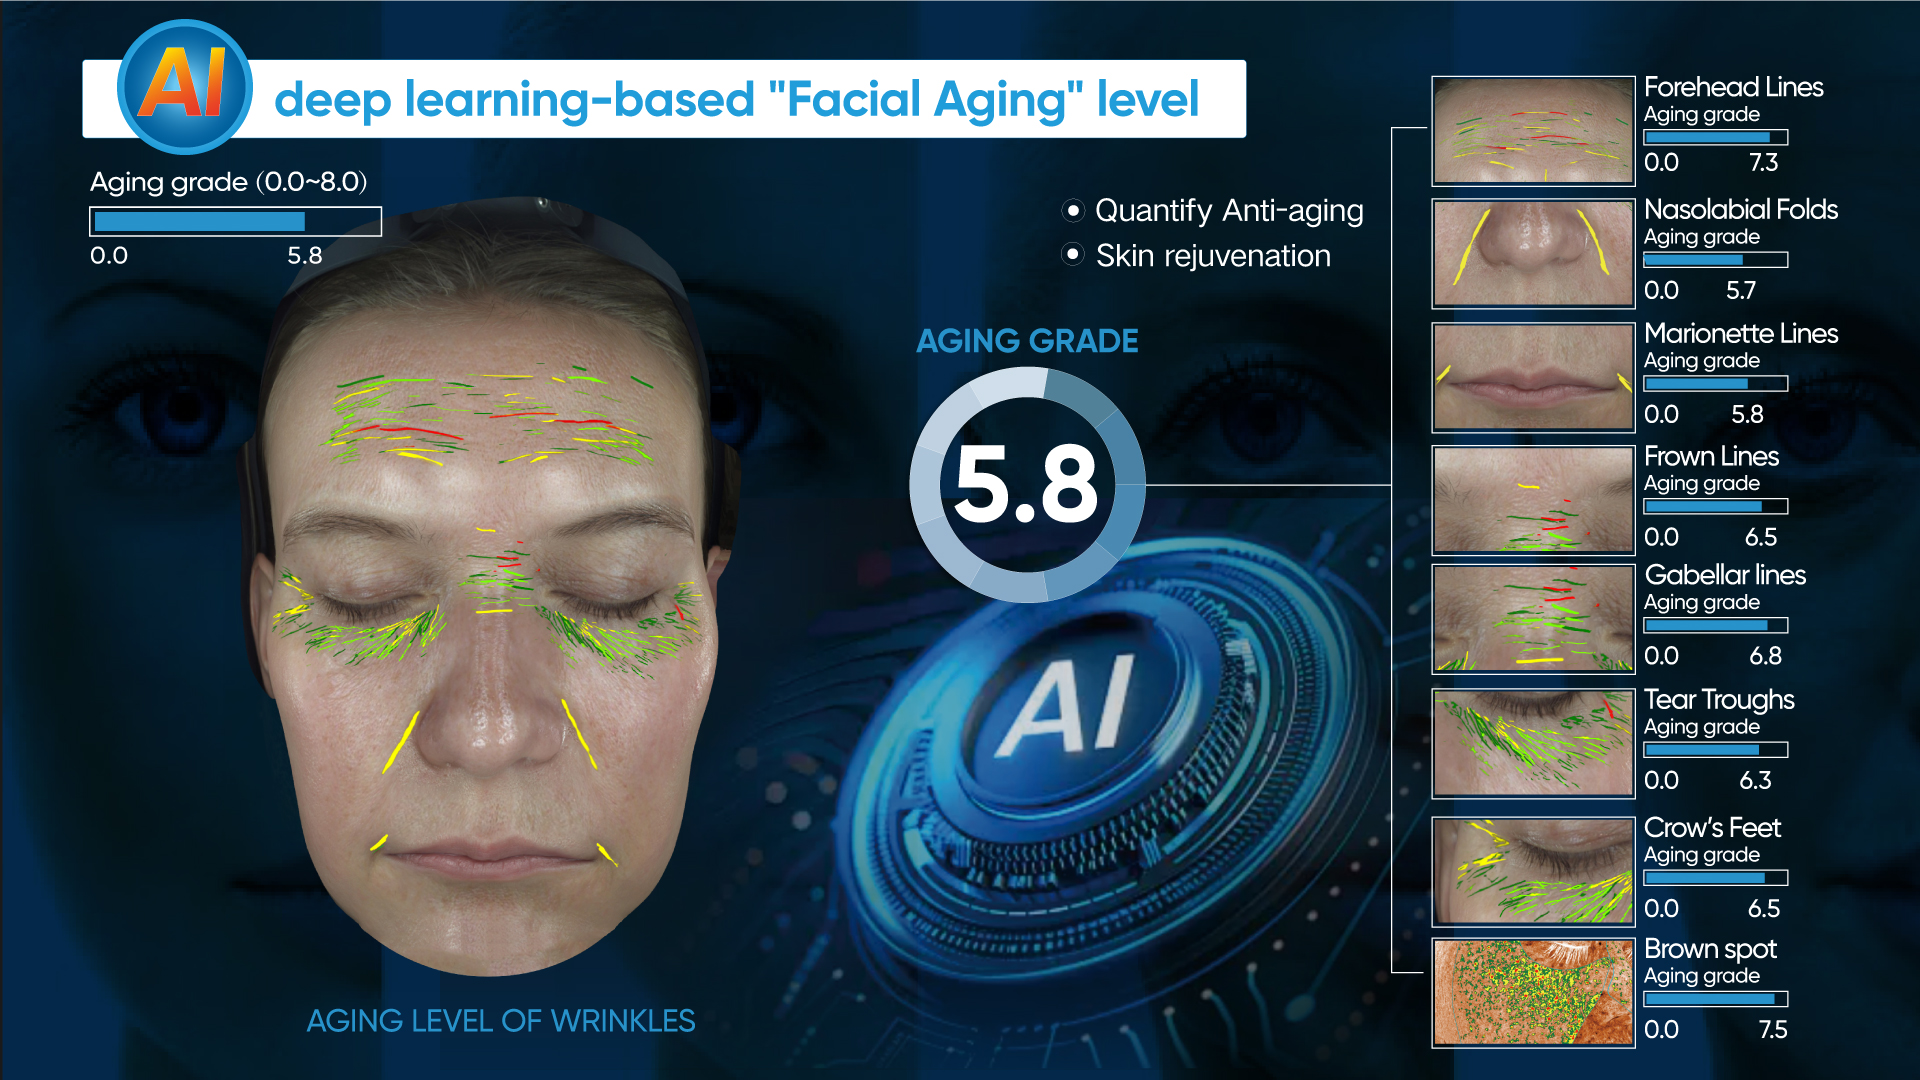
Utilizing big data skin images, we have constructed an aging index model using AI deep learning technolgoy that encompasses 8 dimensions: forehead lines, glabellar lines, crow’s feet, periorbital lines, laugh lines, marionette lines, corner of mouth lines, and brown spots.
AI Technology- deep learning for facial aging analysis
—————————————————————————————————
Professional Facial Aging Grading Analysis
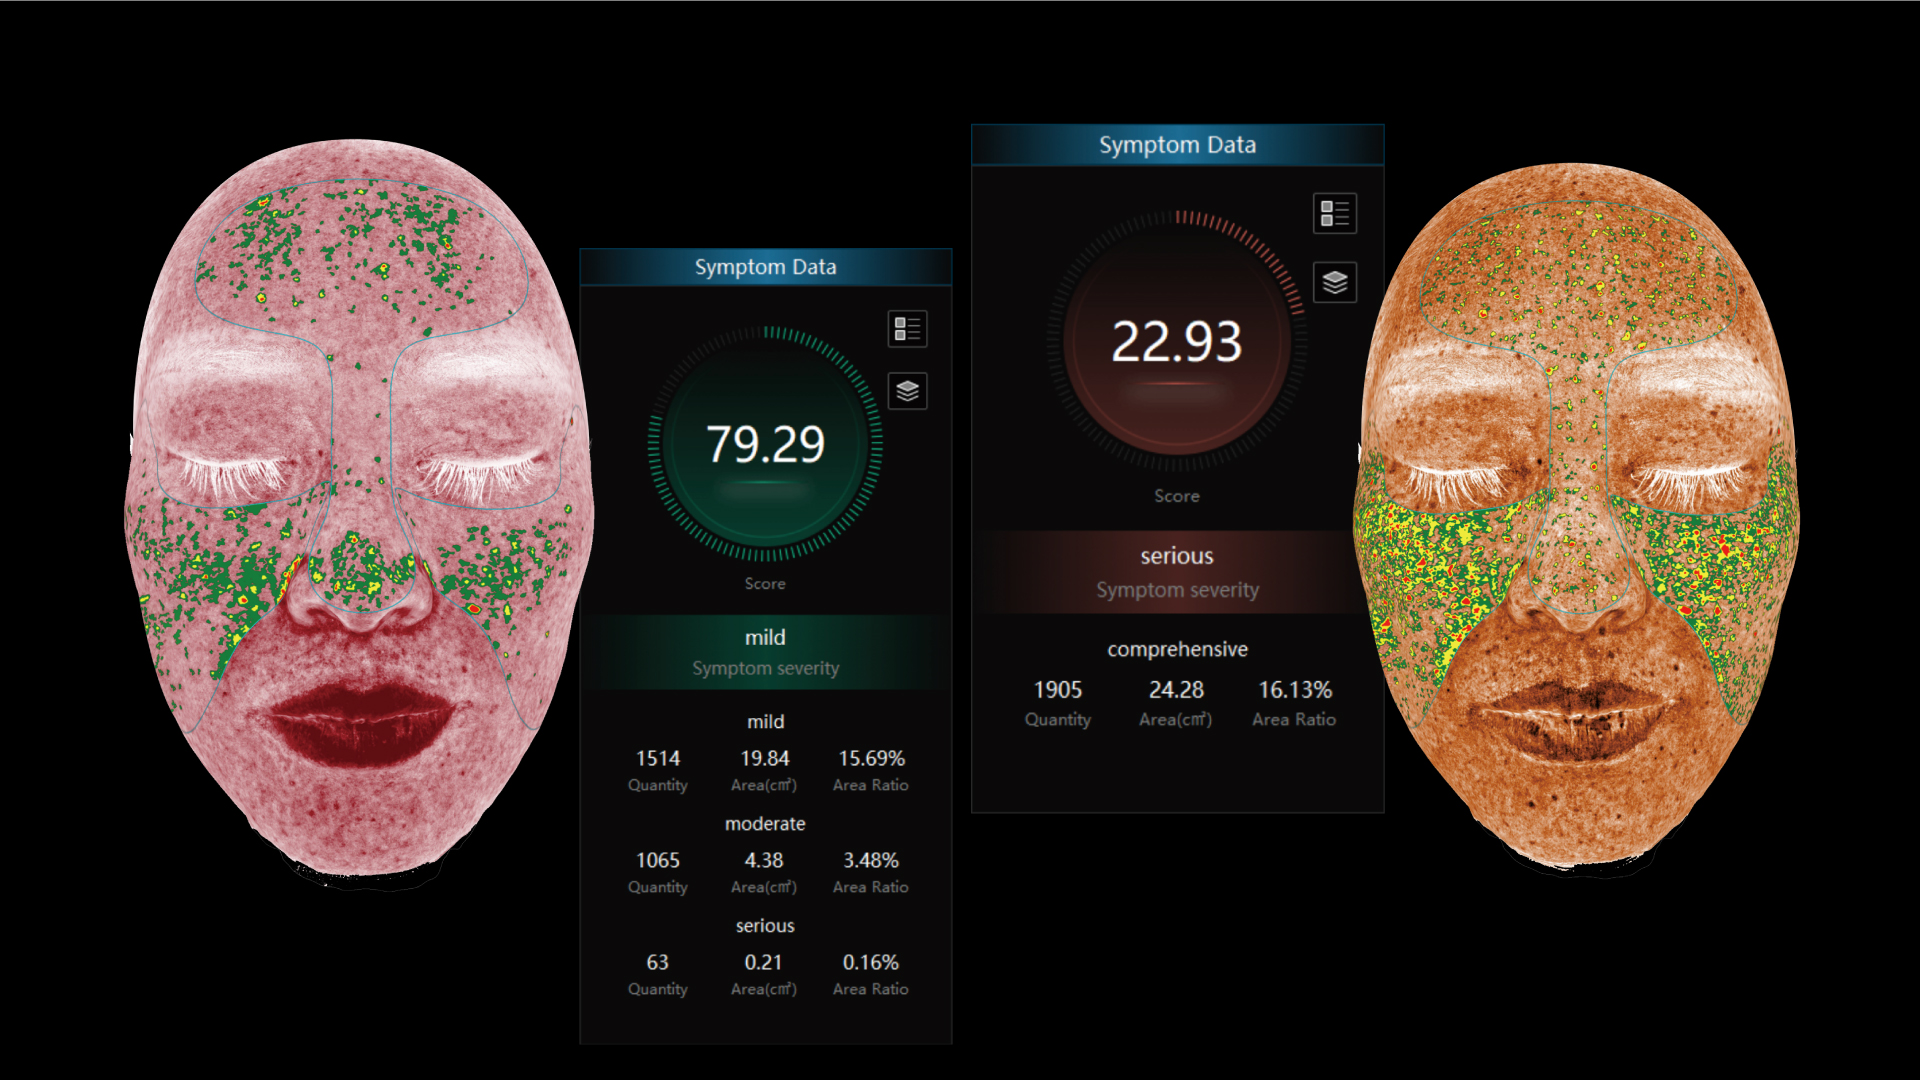
Distinguishing between mild, moderate,and severe symptom categories
—————————————————————————————————
To divide brown spots and sensitive areas into three levels (mild, moderate, severe) using image thresholding techniques and provide visual annotations.


12 HD FULL-FACE 3D IMAGES
—————————————————————————————————
The ISEMECO 3D D9 encompasses 12 high-definition full-face 3D images that can penetrate deeper layers of the skin, facilitating the easy interpretation of various skin issues. These images are not only suitable for skin analysis but also applicable to anti-aging and minimally invasive cosmetic procedures. Additionally, these images cater to the usage needs of doctors from multiple departments.


3D Aesthetic Function

Software Advantages
-

Volume Difference Calculation
It can demonstrate the specific quantification of facial morphological improvements before and after (showing the increase or decrease in facial volume within specific areas). The precision is as high as 0.1ml, accurately presenting even small volume changes.
-

Filler Volume Calculation & Accurate Facial Morphology Analysis
Our skin imaging analyzer is equipped with the Horizontal Thirds and Vertical Fifths, and Contour Morphology Evaluation functions, enabling a comprehensive assessment of the face. With these features, doctors can efficiently identify facial defects and evaluate facial symmetry and concavity issues. This greatly enhances diagnostic efficiency and accuracy. Doctors can quickly and accurately understand the facial defects, allowing them to optimize and adjust treatment plans with precision. This enables doctors to better meet the needs of patients by providing precise and personalized treatment plans, ultimately maximizing improvements in facial defects.
-

Overlap comparison
The overlapping comparison feature in aesthetic design allows you to select different time points for comparison. It primarily focuses on observing the positional changes and volume changes after cosmetic procedures. Warm tones indicate an increase in volume, while cool tones indicate a decrease in volume.
-

3D Before-After Comparison
The D9 Skin Imaging Analyzer) has a feature that allows for the rapid generation of comparative cases, showcasing valuable information such as symptom names, care procedures, and durations. All generated cases are automatically recorded in the system's case database. The case database is organized and stored based on different symptoms and procedures, greatly enhancing the efficiency of retrieving and reviewing cases in the future. With this feature, doctors and skincare professionals can conveniently access and compare different cases and care plans, enabling them to formulate more accurate and targeted treatment strategies. This functionality significantly improves work efficiency and reduces the burden of manual organization and management.
-

Check Report Remotely
Simultaneous login and access from multiple devices such as iPads and computers, supporting both landscape and portrait viewing modes, with the ability to view and synchronize analysis data locally or remotely.
-

Customized report generation
The ISEMECO D9 skin analyzer can incorporate the client's 3D full-face images, the doctor's analysis recommendations, and recommended skincare plans into the report. By combining images and text, it generates professionally customized reports to help clients better understand the doctor's diagnosis and subsequent skincare strategies.
-

DATA CENTER
Accurately analyze consulting or visiting customer information.


PRODUCT PARAMETER
—————————————————————————————————–———————
Name:3D Skin Analyser
—————————————————————————————————–———————
Model number:D9
—————————————————————————————————–———————
Spectra:RGB Light/Cross-polarized Light/UV Light/Parallel-polarized Light
—————————————————————————————————–———————
Lighting Technology: Solid State LED
—————————————————————————————————–———————
Input Requirements: 24V—5A
—————————————————————————————————–———————
Rated power:Standby power:15w Maximum power:50w
—————————————————————————————————–———————
3D structured light:Binocular grating
—————————————————————————————————–———————
Modeling Accuracy:0.2mm
—————————————————————————————————–———————
Laser band: 650nm
—————————————————————————————————–———————
CMOS Dimensions:1’ inch
—————————————————————————————————–———————
Field of View (FOV):40°X40°
—————————————————————————————————–———————
Full face pixel:42 million pixels
—————————————————————————————————–———————
Material:ABC, PC, Silicone, Metal
—————————————————————————————————–———————
Interface:USB3.0 DC
—————————————————————————————————–———————
Instrument size(mm):L:450mm W:640mm H:560mm
—————————————————————————————————–———————
Package Size(mm):L:740mm W:530mm H:650mm
—————————————————————————————————–———————
Instrument weight:kg:19.5kg
—————————————————————————————————–———————
Weight of the whole machine (including packaging):kg:32.8kg


Contact US to Learn More
- English
- Chinese
- Armenian
- Azerbaijani
- Amharic
- Albanian
- Arabic
- Afrikaans
- Belarusian
- Bengali
- Bosnian
- Bulgarian
- Basque
- Czech
- Catalan
- Cebuano
- Chichewa
- Corsican
- Croatian
- Dutch
- Danish
- Esperanto
- Estonian
- Filipino
- French
- Finnish
- Frisian
- Galician
- Georgian
- Gujarati
- German
- Greek
- Haitian
- Hausa
- Hawaiian
- Hebrew
- Hmong
- Hindi
- Hungarian
- Icelandic
- Indonesian
- Igbo
- Italian
- Irish
- Javanese
- Japanese
- Korean
- Kannada
- Kinyarwanda
- Turkmen
- Kazakh
- Khmer
- Kurdish
- Kyrgyz
- Lao
- Latin
- Latvian
- Lithuanian
- Luxembou..
- Macedonian
- Malagasy
- Malay
- Malayalam
- Maltese
- Maori
- Marathi
- Mongolian
- Burmese
- Nepali
- Norwegian
- Oriya
- Polish
- Pashto
- Persian
- Punjabi
- Portuguese
- Romanian
- Russian
- Serbian
- Sesotho
- Sinhala
- Slovak
- Slovenian
- Somali
- Samoan
- Scots Gaelic
- Shona
- Sindhi
- Sundanese
- Swahili
- Swedish
- Spanish
- Tajik
- Tamil
- Telugu
- Thai
- Turkish
- Tatar
- Ukrainian
- Urdu
- Uzbek
- Uyghur
- Vietnamese
- Welsh
- Xhosa
- Yiddish
- Yoruba
- Zulu